The state of Women’s Economic Empowerment
in the Indian
Ocean RIM
Explore the Numbers
The Indian Ocean Rim Association (IORA) recognizes that women’s economic empowerment is a prerequisite for sustainable development, but the full potential of women’s contributions to the Indian Ocean Rim remains untapped. Gender inequalities persist in all IORA countries as women continue to face structural and institutional barriers to their economic empowerment and the enjoyment of their rights to and at work.


Close
 This is an interactive chart; roll over for more information.
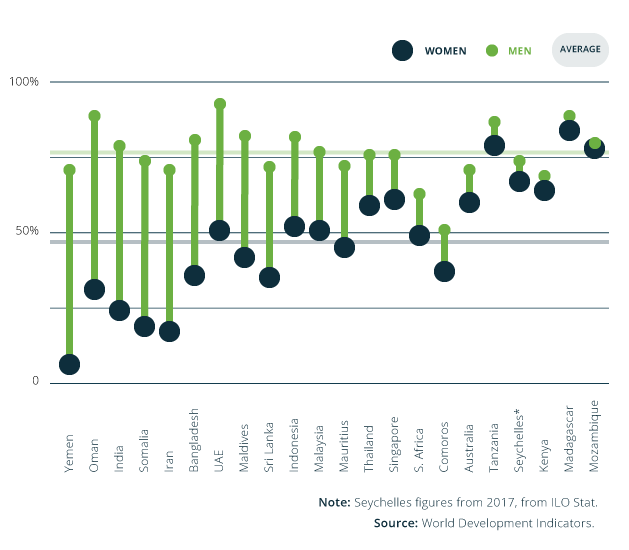
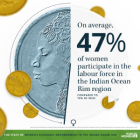
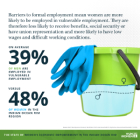
Difference in labour force participation between men and women across the region
2015
2020
This is an interactive chart; roll over for more information.
0
25%
50%
75%
100%
77%
48%
76%
47%
Yemen
India
Oman
Bangladesh
Iran
UAE
Sri Lanka
Indonesia
Mauritius
Malaysia
Singapore
Thailand
Comoros
S. Africa
Australia
Kenya
Tanzania
Madagascar
Mozambique
Yemen
Oman
India
Somalia
Iran
Bangladesh
UAE
Maldives
Sri Lanka
Indonesia
Malaysia
Mauritius
Thailand
Singapore
S. Africa
Comoros
Australia
Tanzania
Madagascar
Kenya
Seychelles*
Mozambique
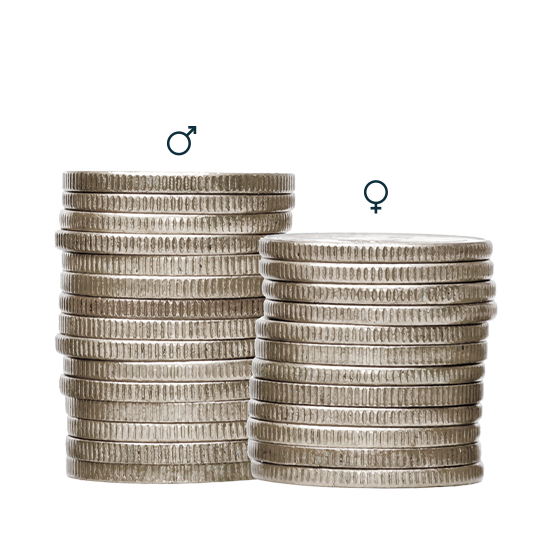
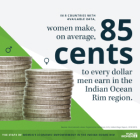
In 8 countries with available data in the region, women make, on average,
85 cents
for every dollar earned by men.
See the DataAlso known as the gender pay gap, this is a major cause of lifetime income inequality. At every level of education, women on average earn less than men.
See the DataDiscriminatory labour policies, social norms and occupational segregation can contribute to the gender pay gap.
See the Data
Close
This is an interactive chart; roll over for more information.
Gender pay gap, broken down by how much women earn for every dollar men earn.
2015
2020
This is an interactive chart; roll over for more information.
Regional Average: 85.4¢
For every dollar earned by a man
Australia
India
Indonesia
Iran
Madagascar
Malaysia
Mauritius
Oman
Seychelles
Singapore
South Africa
Sri Lanka
Tanzania
Thailand
United Arab Emirates
Australia
Bangladesh
Indonesia
Madagascar
Sri Lanka
South Africa
Tanzania
Thailand
Regional Average


The glass ceiling still exists for many women in the region.
Close
This is an interactive chart; roll over for more information.
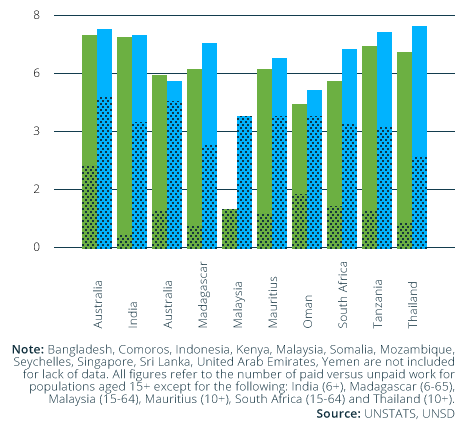
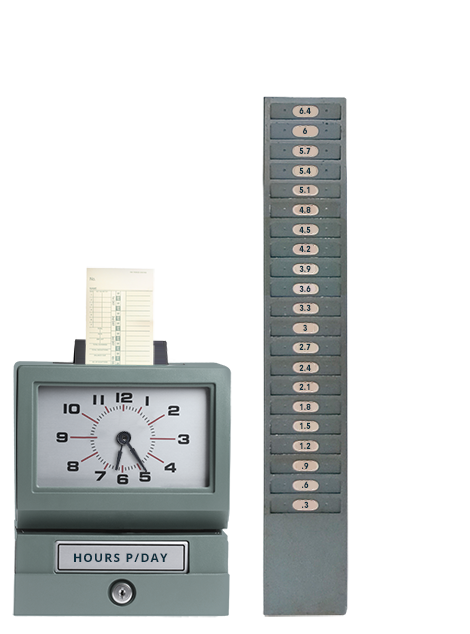
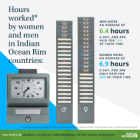
Hours of unpaid care & domestic work done by women and men against total hours worked in a day.
2015
2020
This is an interactive chart; roll over for more information.
0
2
3
6
8
10
Bangladesh
Australia
South Africa
Tanzania
Mauritius
India
Australia
India
Iran
Madagascar
Malaysia
Mauritius
Oman
South Africa
Tanzania
Thailand
No country in the region has reached gender parity in management. On average, women occupy about a quarter of management positions.
See the Data
 See the Data
Close
This is an interactive chart; roll over for more information.
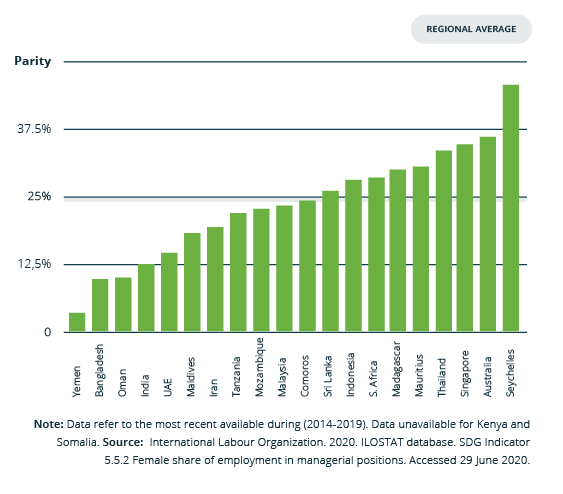
The percentage of all managers who are women across the region
Percentage of management positions held by women in the region, (2014-2018)
2015
2020
This is an interactive chart; roll over for more information.
0
12.5
25
37.5
Parity
23.2%
25.1%
Bangladesh
Oman
UAE
Iran
Yemen
Tanzania
Indonesia
Malaysia
Mauritius
Thailand
Sri Lanka
S. Africa
Singapore
Madagascar
Australia
Seychelles
Yemen
Bangladesh
Oman
India
UAE
Maldives
Iran
Tanzania
Mozambique
Malaysia
Comoros
Sri Lanka
Indonesia
S. Africa
Madagascar
Mauritius
Thailand
Singapore
Australia
Seychelles


All countries in the region provide mandatory maternity leave.
But only half cover the minimum 14 weeks recommended by the International Labour Organization.
Few allow for paid paternity leave.
See the DataPaid maternity and paternity leave policies enable the distribution of care responsibilities and expand women’s choices to remain in the labour force.
See the Data
Close
This is an interactive chart; roll over for more information.
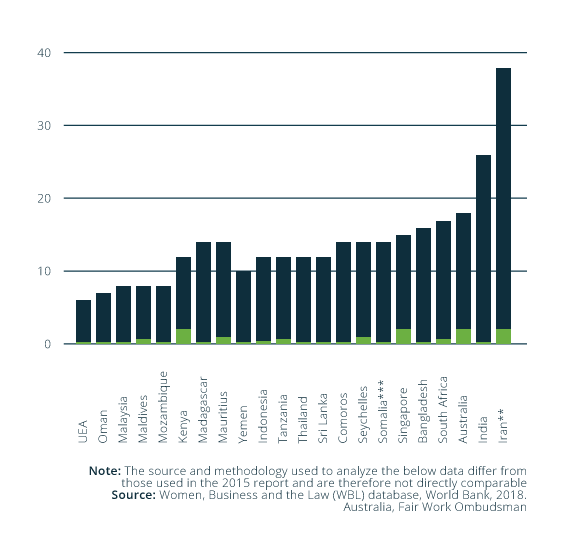
Duration of paid maternity and paternity leave across the region
2015
2020
This is an interactive chart; roll over for more information.
0
10
20
30
40
12 weeks
4 weeks
UAE
Oman
Malaysia
Mozambique
Yemen
India
Mauritius
Sri Lanka
Tanzania
Indonesia
Iran
Kenya
Thailand
Comoros
Madagascar
Seychelles
Bangladesh
Singapore
South Africa
Australia
UAE
Oman
Malaysia
Maldives
Mozambique
Yemen
Tanzania
Singapore
Indonesia
Kenya
Thailand
Comoros
Madagascar
Mauritius
Somalia
Bangladesh
Seychelles
South Africa
Sri Lanka
Australia
India
Iran
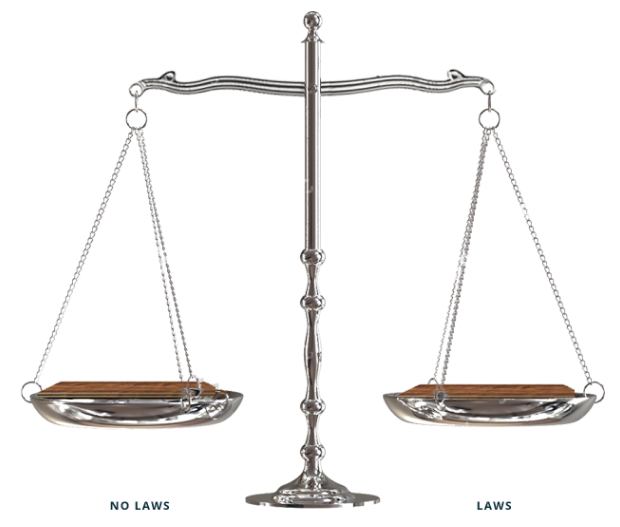
Most countries in the region have some legal protection for women’s right to work and rights at work.
See the Data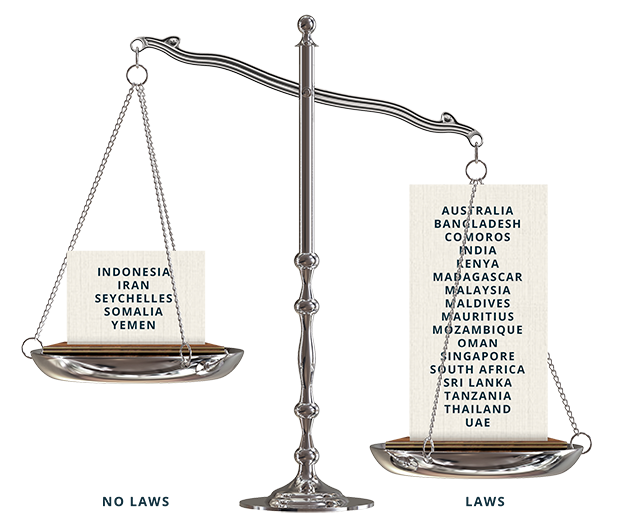
The majority have laws on sexual harassment in employment.
See the Data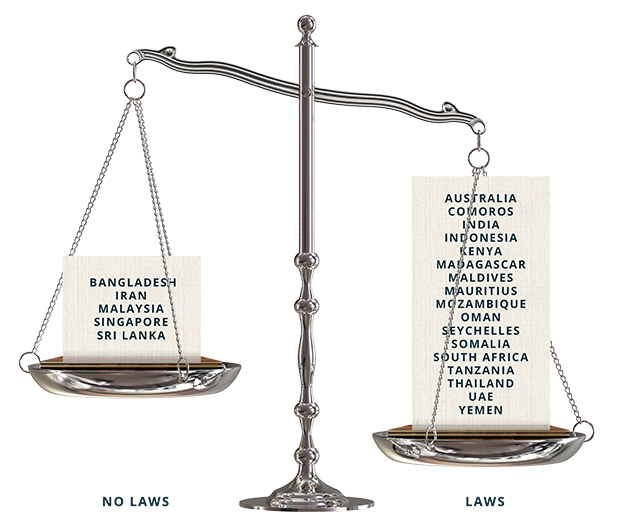
Only five countries lack laws that prohibit gender discrimination in hiring.
See the Data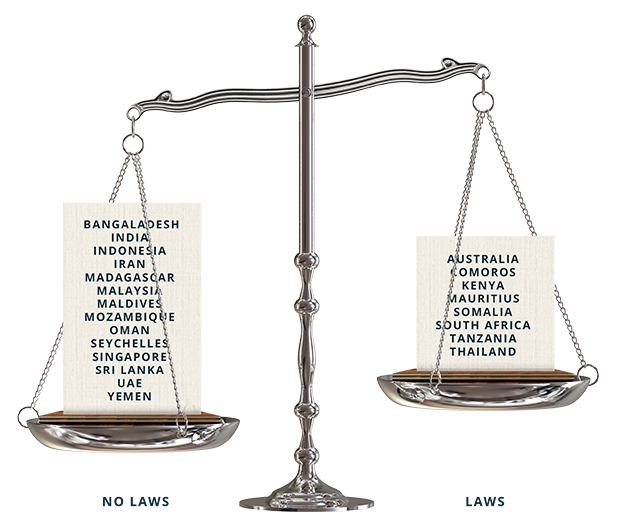
But only a little more than one-third of countries mandate equal pay for work of equal value.
See the Data
Close
This is an interactive chart; roll over for more information.
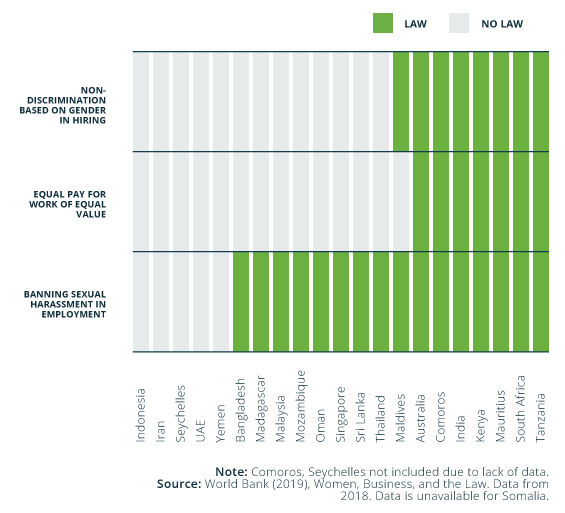
Laws protecting women in the workplace across the region
2015
2020
This is an interactive chart; roll over for more information.
law
no law
Non-discrimination Based on Gender in Hiring
Equal Pay for Work of Equal Value
Banning Sexual Harassment in Employment
Yemen
Oman
Mozambique
Sri Lanka
UAE
Thailand
South Africa
Singapore
Malaysia
Iran
Indonesia
Madagascar
Kenya
Bangladesh
India
Mauritius
Tanzania
Australia
Iran
Bangladesh
Malaysia
Singapore
Sri Lanka
Indonesia
Seychelles
Yemen
India
Madagascar
Maldives
Mozambique
Oman
Somalia
UAE
Australia
Comoros
Kenya
Mauritius
South Africa
Tanzania
Thailand

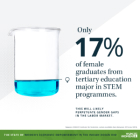
Education leads to increased opportunities in the workforce and enhances women's economic empowerment.
But female students are underrepresented in science, technology, engineering and mathematics (STEM) education.
See the Data
In the IORA region, only
17 %
of female graduates from tertiary education major in STEM programmes
See the Data
versus
34 %
of male graduates.
This will likely perpetuate gender gaps in the labor market.
See the Data
Close
This is an interactive chart; roll over for more information.
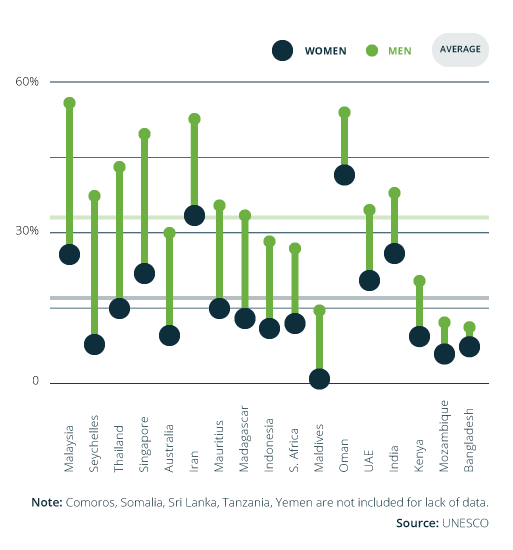
Percentage of male/female graduates from STEM programmes in tertiary education
This is an interactive chart; roll over for more information.
0
15%
30%
45%
60%
34%
17%
Malaysia
Seychelles
Thailand
Singapore
Australia
Iran
Mauritius
Madagascar
Indonesia
S. Africa
Maldives
Oman
UAE
India
Kenya
Mozambique
Bangladesh

Barriers to formal employment mean women are more likely to be employed in vulnerable employment. They are therefore less likely to receive benefits, social security or have union representation and more likely to have low wages and difficult working conditions.
See the Data
Close
This is an interactive chart; roll over for more information.
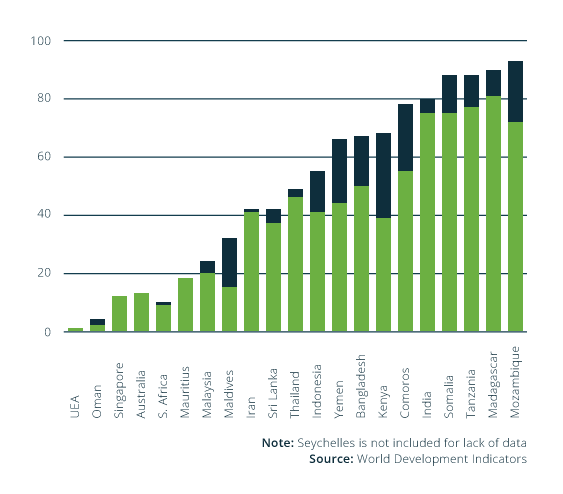
Vulnerable employment, Percent of male and female employment (2019)
This is an interactive chart; roll over for more information.
0
20
40
60
80
100
48%
39%
UAE
Oman
S. Africa
Singapore
Australia
Mauritius
Malaysia
Maldives
Iran
Sri Lanka
Thailand
Indonesia
Kenya
Bangladesh
Yemen
India
Comoros
Tanzania
Madagascar
Mozambique
Somalia

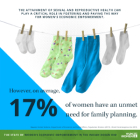
The attainment of sexual and reproductive health can play a critical role in fostering and paving the way for women's economic empowerment.
See the Data
The availability and use of modern contraception enable women to plan and make critical decisions about their future.
See the Data
Close
This is an interactive chart; roll over for more information.
Percentage of needs met for family planning
This is an interactive chart; roll over for more information.
Regional Average: 83.1%
Bangladesh
Comoros
India
Indonesia
Iran
Kenya
Madagascar
Maldives
Mauritius
Mozambique
Oman
South Africa
Sri Lanka
Tanzania
Thailand
Yemen
Regional Average

Despite progress, multiple obstacles and inequalities persist.
To achieve gender equality and women’s economic empowerment, the region needs to strengthen enabling legal and policy environments that:
- Support women’s equal participation in labour markets and the world of work
- Reduce vulnerable employment by ensuring decent work and social protection for all workers
- Prevent gender discrimination in the workplace, in hiring, retention, and promotion
- Reduce and redistribute women’s disproportionate share of unpaid care and domestic work
- Promote women’s and girls’ opportunities for training and support the school to work transition, particularly in STEM fields
Enhanced investment in such policies and initiatives, based on improved sex-disaggregated data and gender statistics, will bolster women’s important economic contributions throughout the region while upholding and protecting their rights to and at work.
Women’s Economic Empowerment in the Indian Ocean Rim: Progress and Challenges
Download the 2020 Report Download the New Poster Download the 2015 ReportWant to share the stats & graphics?
View stats by individual country breakdowns:
Close
This infographic provides an updated snapshot of the status of women’s economic empowerment in the Indian Ocean Rim region by visualizing data that was included in the 2020 report “Women’s Economic Empowerment in the Indian Ocean Rim: Progress and Challenges”. Data from the 2015 baseline study “Enabling Women’s Contributions to the Indian Ocean Rim Economies” are also included to illustrate trends over time.
Both studies have confirmed that women participate in nearly every aspect of the economy in the countries of the Indian Ocean Rim – in both formal and informal work. While the countries in this region vary considerably in terms of their areas, populations and levels of economic development, they share many of the same challenges and opportunities for women’s economic empowerment. It is important to note that the 2020 report includes data from sources published prior to the COVID-19 pandemic, which has further exacerbated many of the obstacles to women’s economic empowerment in the region.
In 2018, Indian Ocean Rim Association (IORA) Member States reaffirmed their commitment to women’s economic empowerment in the Balaclava Declaration on Women’s Economic Empowerment and Gender Equality as a Pre-Requisite for Sustainable Development. Member States acknowledged that women’s economic empowerment is a foundational element of gender equality and the full and equal realisation of women’s human rights and is thus integral to all dimensions of inclusive and sustainable development.
UN Women would especially like to thank the Australian Government Department of Foreign Affairs and Trade for their contributions to producing the infographic and the associated report.